The Dashboard delivers instant visualisation of business against target

The Dashboard delivers a summary of all key Workforce Metrics in a simple consolidated view measuring performance against benchmark targets. 

CPM Management Studio© 's Dashboard brings together all of the key Workforce Metric results into a single consolidated view.  With comparisons against agreed business benchmarks, it is easy, in a single glance, to observe which key Workforce Indicators are falling outside the target parameters.

Through the Dashboard Studio any number of user-defined Dashboard Indicators can be established.  Access to each of the Dashboard indicators can be varied by user profiles.  Access to information being displayed within the Dashboard is also limited to a users access profile so that they only see what is relevant to them.
What makes the Dashboard flexible and customisable for each client is  the sophisticated Dashboard Accumulator modeller, Any number of Dashboard accumulators can be defined for each Metric result set.

The Accumulator Modeller can be used to create any number of focused Key Performance Results like filtering out the Annual Leave Balances for Permanent Staff from a Leave Liability Metric to deliver a Dashboard Indicator of the Average Balance for Permanent Staff.   Another example could be the selection of Service Length for Permanent Staff from the Staff Attrition Metric to provide the Average Service Length of Permanent Staff, or maybe the Service Length of Leavers to provide the Average Service Length of Leavers.

Also, in defining a Dashboard Indicator, accumulators from two totally different Metric Tables can be used to create the Dashboard Result.  An example may be to use the Permanent Full Time FTE’s Paid for a Month from a Monthly Manhours Metric compared to the Permanent Full Time Head Count from a Monthly Staff Headcount to derive the Ratio of Permanent Full Time FTE’s paid to the Permanent Full Time Headcount.


Through the Dashboard there is access to Dashboard history as well as the ability to drill down through the organisation on any Metric result.  Access to information when drilling down through the Dashboard is also access controlled so that users only see what is applicable to them.

This ability to drill down through Dashboard creates an environment of transparency and consistency.  All layers of Management are presented with the same consistent results with the same standard definition of the the key Workforce Performance Measure.  Drilling down through their organisational tree Managers can also identify what is impacting their result.

There is also a quick, one click display of the last two years results as a Trend Line graph.Setting of Target Results can be set globally or specified for each layer of the business.  Dashboard Target history is also available where Budgets or Targets can be set for each month of the year.  Examples of where varying Targets might be used would be where an overall Attrition Target of 15% is applied for the entire company with the exception of the Contact/Call Centre which has an acknowledge retention issue for which a specific target of 25% is set.
A number of specialised Templates are 
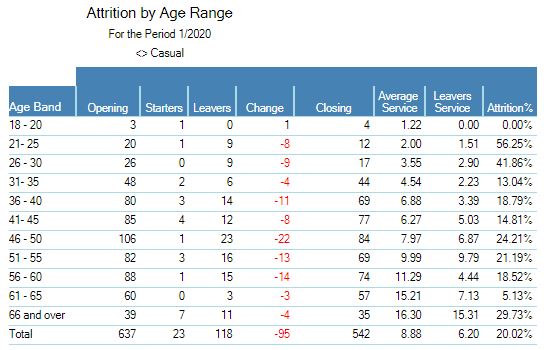
also included which offer comprehensive Workforce Reporting options such as the Staff Attrition Template which includes the Opening Balance for the start of the Reporting Period, the number of Starters and Leavers within the Reporting period, the Nett Change for the reporting Period, the Average Service Length of All Staff for the dissection, the Average Service Length of the Leavers for the Dissection and the % Attrition Rate for the Reporting Period.  In this example the Attrition Figures are being shown for user defined Age Bands.